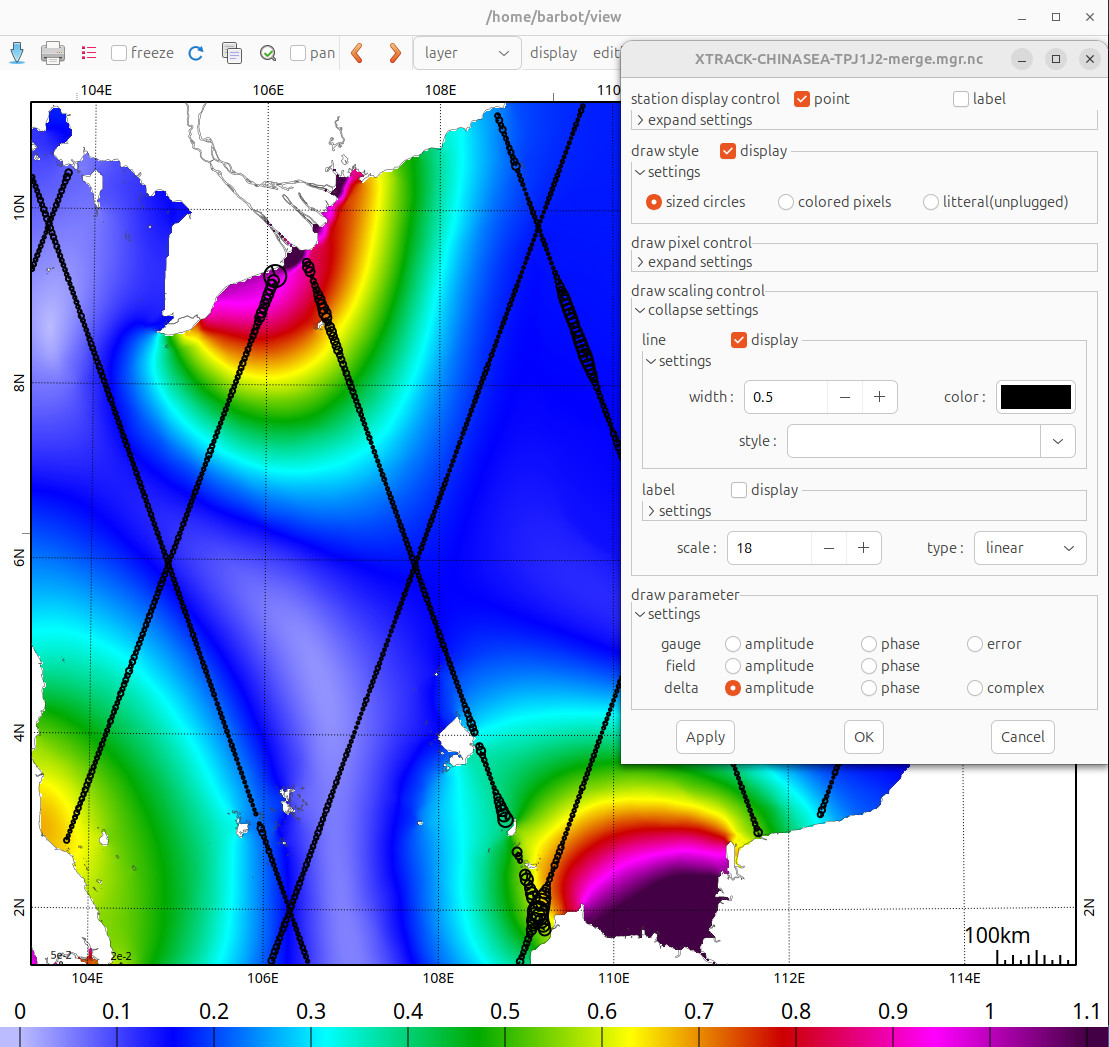
Tidal harmonics validation with altimetry track and tide gauges
Two methods are possible to compare the background field and a pixel cloud dataset.
Display the pixel cloud on the scale scale
You can compare the tidal harmonics of the background field with the observation (*.mgr or *.mgr.nc)
Display harmonics (amplitude and phase)
Primary menu → [mgr file], then Secondary menu → wave → M2
For the observation data point, you can choose if you want to plot the amplitude, phase of the difference to the background field:
Primary menu → [mgr file]
View windows → display → select data points settings… [F12]
draw style → [colored pixels]
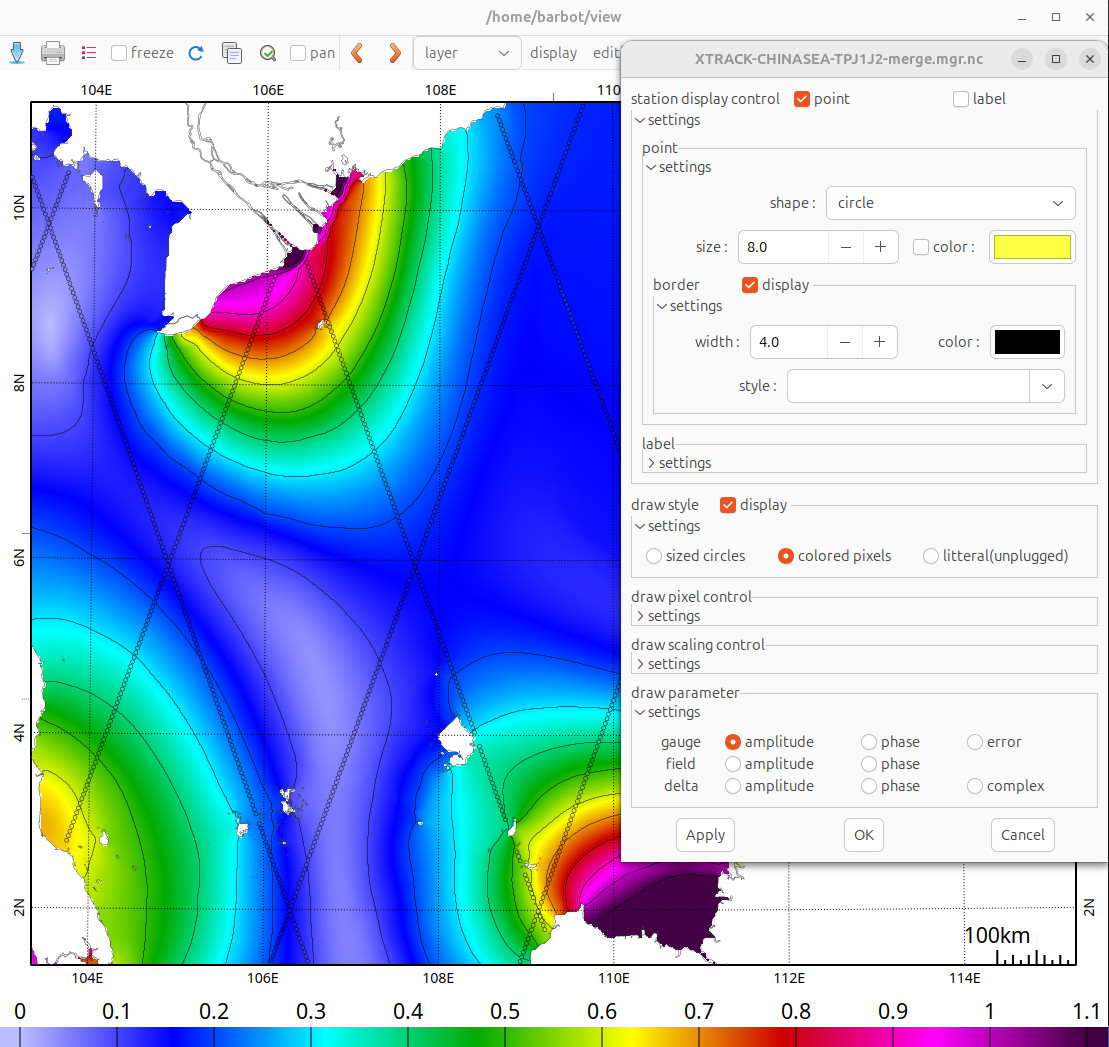
Display the difference between the pixel cloud and the background
On the data points settings window, choose one of the delta option to plot the difference at each pixel cloud. Then, for now, the difference will be display on the same scale than the background field. In order to improve the display, you need to mask the background:
draw parameter → [delta amplitude/complex]
Primary menu → formulaAndIso → pmask = (lat > -90)
View window → [isoline values] → custom range
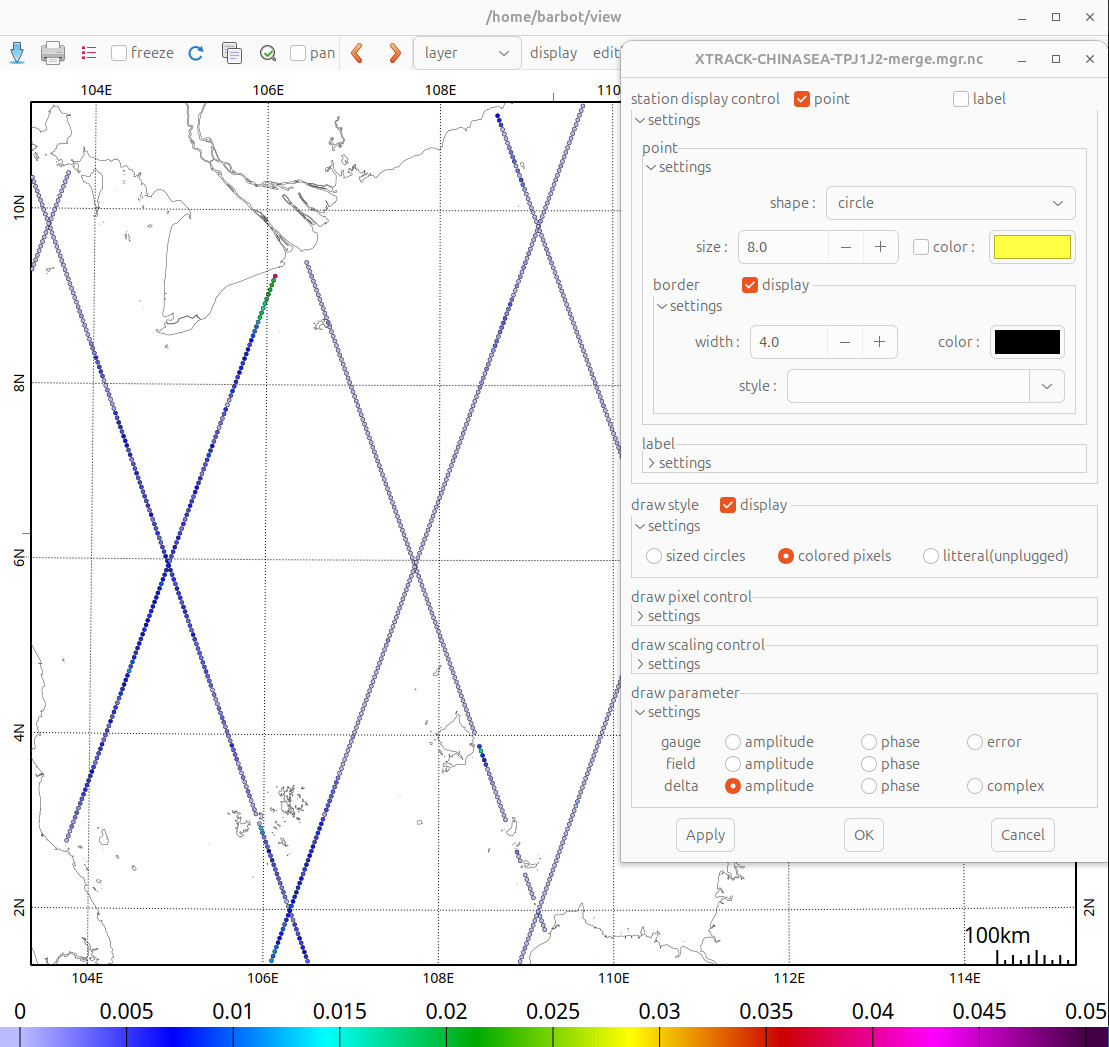
Display the difference between the pixel cloud and the background
On the data points settings window, choose one of the delta option to plot the difference at each pixel cloud. Then, for now, the difference will be display on the same scale than the background field. In order to improve the display, you need to mask the background:
Primary menu → [mgr file]
View windows → display → select data points settings… [F12]
draw style → [sized circles]