Colormap, Range, and Isolines
Customizing Colormaps
Other preset colormaps are accessible by [left click] on the colorbar (or Menu windows → settings → palette). You can change the colors of the palette, their dispositions, etc., and apply your changes using the Status box → ✓ mark.
Adjusting Range and Distribution
To change the range and the distribution of the colorbar ticks:
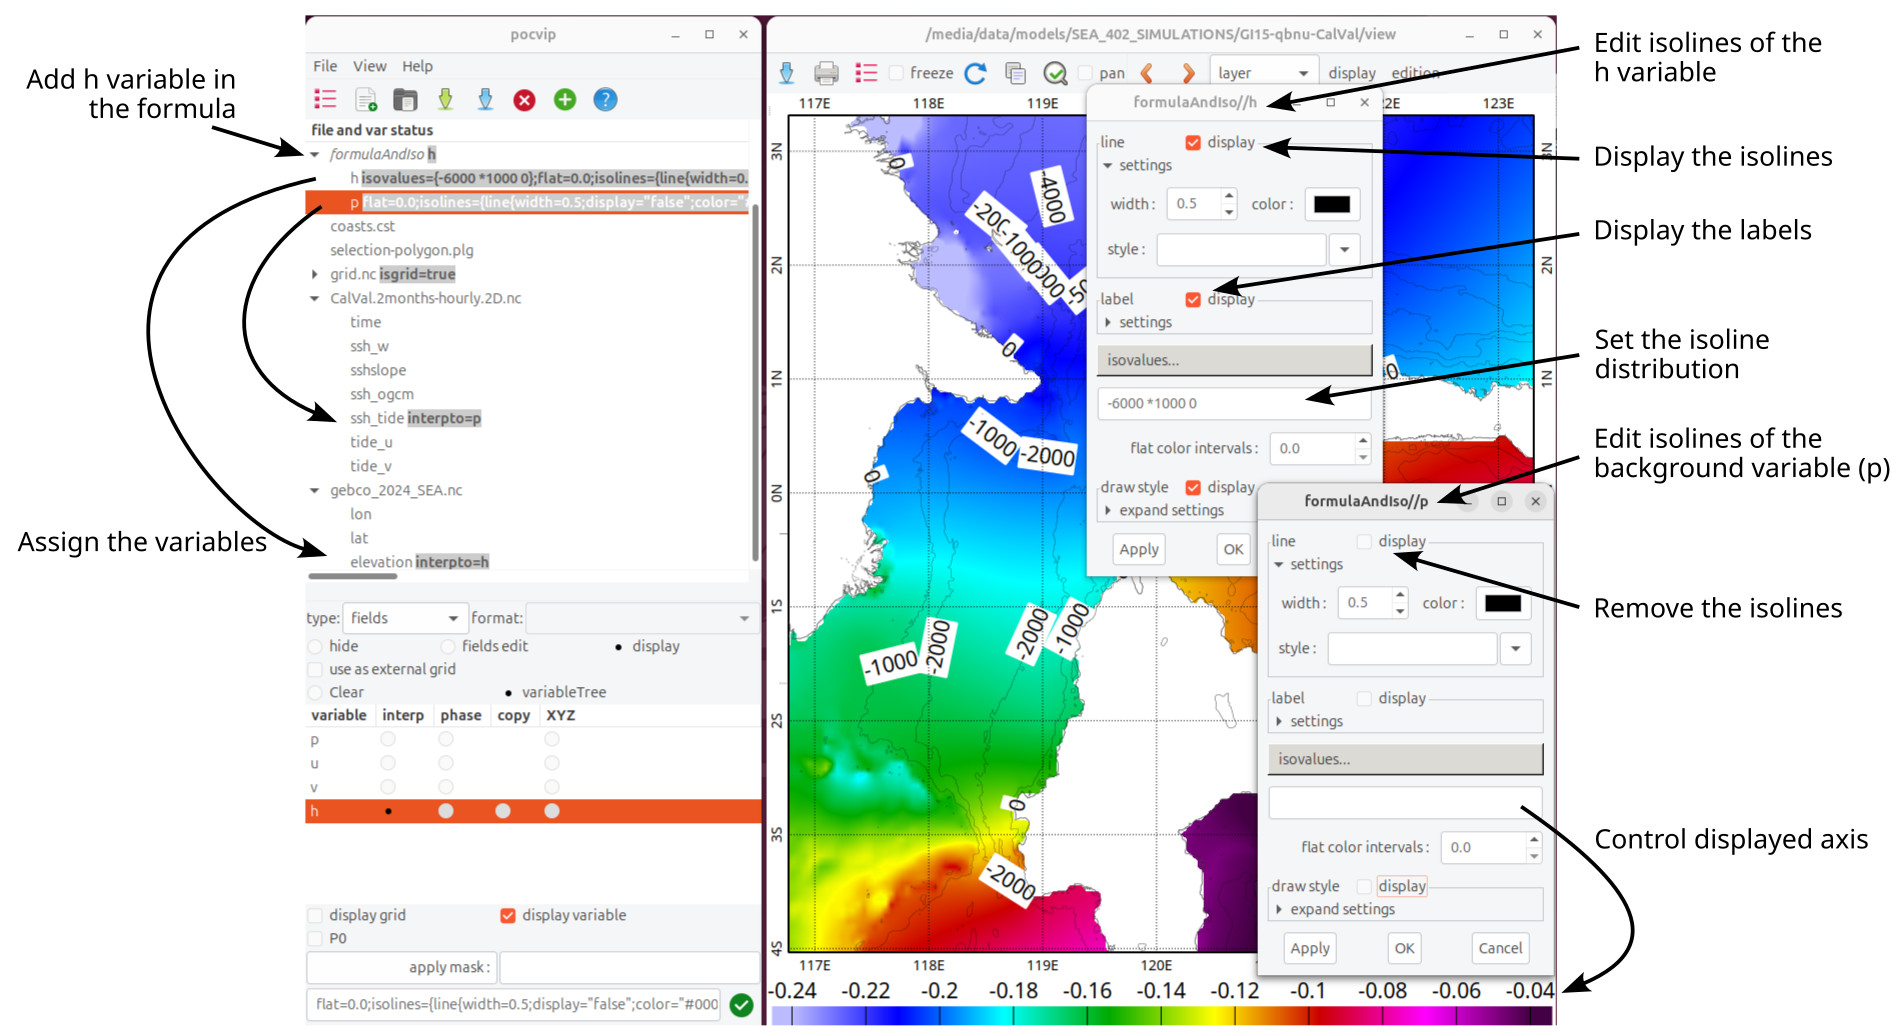
[Left click] on the value labels to open the Display settings window.
Use the menu “Isovalues…” and the text box below:
Two values: Indicate the minimum and maximum.
More than two values: Uniformly distribute these isolines along the colorbar, regardless of their value (non-linear ticks).
%[0-100]: For the percentile of the displayed value.
*[dx]: Between minimum and maximum, sets the step between isolines (dx).
/[nx]: Between minimum and maximum, sets the number of isolines (nx).
Edit the thickness and the color of the isolines in this text box as well.
TIPS: You can define h1 = h to define different line style and distribution to get major isolines with h and minor isolines with h1.
Adding Additional Isolines
For additional isolines (e.g., bathymetry isolines on top of the currently displayed field):
Menu windows → formulaAndIso →
h.Assign this new variable to the dedicated field.
Select this variable in the formulaAndIso menu.
View window → display → selected formula variable settings…